Measuring phase noise

Measuring phase noise

Signal and spectrum analyzer technology

Speak to an expert

Signal and spectrum analyzer technology | Measuring phase noise

Measuring phase noise with a spectrum analyzer

Author: Paul Denisowski, Test & measurement expert

Phase noise describes short-term variations in phase or frequency stability. Here, “short-term” means time periods of seconds or less. Another way of defining phase noise is random or intentional phase modulation. Short-term stability or good phase noise performance in very important in a wide variety of RF applications, as phase noise can cause spectral regrowth, increased bit errors and decreased sensitivity and selectivity. However, this short-term stability can be difficult to obtain, with substantial cost and complexity often associated with even modest increases in phase noise performance.

Oscillators and phase noise explained

An oscillator is a device that generates a signal at a given frequency. Oscillators are critical components in many electronic devices, and it’s not uncommon for a single RF device to have multiple oscillators. The frequency or phase stability of an oscillator is very important: an oscillator output should be as stable as possible.

All real-world oscillators exhibit some amount of frequency or phase variation. This variation is the phase noise. Excessive phase noise can cause serious problems in many applications. Therefore, it’s important to accurately measure this level of instability.

The output of an ideal oscillator is usually a purely sinusoidal signal. If you look at this ideal signal in the frequency domain, you’ll see that the pure sinusoid appears as a signal narrow spectral line, with all its power at one single frequency.

A real oscillator signal differs from the ideal signal in two ways:

  • The radial frequency is still a constant, but both the amplitude and phase offset are functions of time, i.e., the amplitude and phase are not constant.
  • Phase noise shifts where the sinusoid crosses the x-axis. This phenomenon is often referred to as “jitter.” In the frequency domain, this creates sidebands or “skits” on either side of the carrier.

In most cases, the effects of phase noise are more signficant than the effects of amplitude variations.

Ideal oscillator (left) vs. real oscillator (right)

The three most common effects of phase noise are:

  • Spectral regrowth: The phase noise is mixed with the input signal, leading to an output whose mixing products are distorted and spread in frequency due to the phase noise present in the local oscillator.
  • Reciprocal mixing: An excessive amount of phase noise can cause problems when working with an IF filter because it spreads the energy of the unwanted signal into the filter, making it problematic to recover the smaller signal.
  • Increased bit errors: Most modern wireless technologies use modulation schemes that are often representation using constellation diagrams, and phase noise causes a rotation of this constellation, with higher phase noise causing greater rotation and a higher bit error rate.

Understanding phase noise fundamentals and spectral regrowth

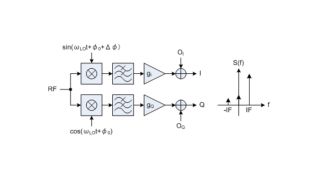
To understand spectral regrowth, you need to know about mixing. A mixer is a device that can be used to move signals from one frequency to another. It does this by combining an input signal with a local oscillator to produce an output that contains not just the original signals but also signals at the sum and difference of these two frequencies.

Mixing is widely used in RF receivers for two reasons:

  • It’s generally easier to work with lower frequency signals.
  • Mixing allows the use of fixed frequency filters, amplifiers, etc., so that you can mix the signals “up” or “down” to a convenient frequency for processing.

Phase noise in the local oscillator is also mixed with the input signal, leading to an output with mixing products that are distorted and spread in frequency. This phenomenon is spectral regrowth.

If the local oscillator has low phase noise, the signal will be mostly contained in its assigned channel with very little power leaking into adjacent channels. However, as the phase noise increases, the signal will grow wider and spread further into adjacent channels. At high levels of phase noise, the spectral regrowth or “adjacent channel leakage” can become severe and cause significant interference.

Spectral regrowth can cause significant interference at high levels of phase noise.

Phase noise and reciprocal mixing

Phase noise can also cause problems due to something called reciprocal mixing, which arises in situations where we have a small wanted signal and a large adjacent unwanted signal. You can mix these signals with a relative “pure” local oscillator to move them down to an intermediate frequency (IF) for processing. The IF filter only selects the desired signal and rejects the larger unwanted signal.

However, if the local oscillator has excessive amounts of phase noise, this will spread energy from the adjacent unwanted signal into the IF filter, making it difficult or impossible to recover the smaller signal. As such, local oscillator phase noise should be kept as low as possible, since this phase noise reduces both receiver sensitivity and selectivity.

Phase noise and bit error rate

Phase noise can also create problems for communications systems that use some form of phase modulation. Most modern high data rate wireless technologies use modulation schemes that are passed on phase and amplitude modulation, e.g., APSK or QAM. These modulation schemes are often represented using so-called constellation diagrams, where each point in the constellation is a “symbol” with a unique amplitude and phase.

Phase noise causes a rotation of the constellation, with higher levels of phase noise causing greater rotation of the points. If this rotation becomes high enough, it’s possible for one symbol to be mistaken for another. This leads to bit errors or a higher bit error rate.

Phase noise causes a rotation of the constellation.

How to measure phase noise

There are two types of instruments that can measure phase noise:

  • Spectrum analyzers are the traditional tool for measuring phase noise. These are flexible, general-purpose instruments that can be used for a wide range of other measurements.
  • Phase noise analyzers are specialized instruments for measuring phase noise. They usually have higher speed and sensitivity than traditional spectrum analyzers.

Measuring phase noise with a spectrum analyzer

Let’s start by looking at the spectrum analyzer method, since this will provide a better understanding of basic phase noise measurement concepts and results.

Spectrum analyzer or “direct spectrum” method:

  • Measure the power of the carrier, i.e., the nominal oscillator output signal, as an absolute power in dBm.
  • Move to a given frequency offset from the carrier and measure the noise power with a 1 Hz bandwidth.
  • Subtract the carrier power from the noise power, and the result is phase noise in units of dBc per Hz.

Note that these values will always be negative. In almost all cases, this process is repeated at different frequency offsets from the carrier, and the results will usually be different at different offsets, generally decreasing the further away you get from the carrier.

In this example, the phase noise is measured at a positive frequency offset from the carrier. Since the “sidebands” created by phase noise are usually symmetrical around the carrier, the measured phase noise will be the same for a given positive and negative offset from the carrier. Here, the phase noise is is -70 dBc/Hz at both +10 kHz and -10 kHz offsets.

Therefore, phase noise is normally only measured on one side of the carrier, and this is called single sideband phase noise. By convention, positive offsets, or the upper sideband is used when measuring and reporting phase noise.

Single sideband phase noise is measured and plotted over a defined offset range. A logarithmic scale is used because it covers a wide frequency range and has finer resolution close to the carrier. Since phase noise is undesirable, lower values in our phase noise plot mean better phase noise performance.

Typically, only the upper sideband is used when measuring and reporting phase.

Note that many phase noise plots have distinct regions in which the phase noise graph has different slopes. This is because the causes or sources of phase noise are often different at different offsets from the carrier.

Many phase noise plots have distinct regions in which the phase noise graph has different slopes.

Another common way of representing phase noise measurement results is spot noise. This is just phase noise measured at specific frequency offsets. By default, these offsets are usually so-called “decade” offsets, i.e., offsets which are powers of ten, such as 1 kHz, 10 kHz, 100 kHz, etc. It’s also possible to measure spot noise at arbitrary, user-defined offsets. Spot noise is commonly given in table form and is most often used to verify that phase noise at a given offset is below a specified threshold.

Spot noise is phase noise measured at specific frequency offsets.

Phase noise analyzer and cross-correlation

Although they present results in the same way, a phase noise analyzer measures phase noise differently from a spectrum analyzer.

There are two important differences:

  • Phase noise analyzers measure phase noise directly, typically using a special digital phase demodulator.
  • Phase noise analyzers use cross-correlation.

In cross-correlation, the incoming signal from the device under test (DUT) is routed through two “identical” measurement paths in the instrument. These paths have independent oscillators, each of which has a slightly different, or “uncorrelated,” phase noise. These two paths feed a cross-correlation function that can then remove the uncorrelated phase noise generated by the instrument, allowing a more precise and sensitive phase noise measurement. Increasing the number of cross correlations further increases the sensitivity, allowing extremely low levels of phase noise to be measured.

Phase noise analyzers, therefore, have the advantage of being much faster, especially when measuring close-in offsets. They also have much greater measurement accuracy and sensitivity.

Rohde & Schwarz just revolutionized spectrum analysis by launching the FSWX - the world's first signal and spectrum analyzer that supports cross-correlation.

Summary of phase noise

  • An ideal oscillator produces a signal with a frequency, amplitude and phase that do not vary over time.
  • Phase noise describes the short-term variations in the frequency or phase of signals produced by real-world oscillators.
  • Phase noise is undesirable, and phase noise measurements are used to quantify the phase noise performance of devices or systems.
  • Phase noise measurement results are typically given in a single sideband plot, which shows phase noise as a function of carrier offset, and spot noise, which is a measurement of phase noise at specific offsets.
  • The two types of instruments that are used for phase noise measurements are (1) spectrum analyzers and (2) phase noise analyzers.
  • Traditional spectrum analyzers often support automated phase noise measurements in addition to their many other functions.
  • Dedicated phase noise analyzers contain special hardware designed to make very fast and accurate measurements of phase noise.

Phase noise analyzers frequently incorporate a cross-correlation function to reduce the influence of instrument phase noise and maximize measurement sensitivity.

Want to discuss your specific signal and spectrum analysis test cases with our experts?

Featured spectrum analyzer technology content

Introducing our game-changer – the FSWX

Discover the world’s first multi-channel, phase coherent, cross-correlated, wideband signal & spectrum analyzer.

More information

Understanding basic spectrum analyzer operation

Get an introduction and learn the basic settings needed for making power versus frequency measurements using a spectrum analyzer.

More information

Application note

A 1 MHz to 50 GHz Direct Down-Conversion Phase Noise Analyzer with Cross-Correlation

More information

Understanding noise power ratio measurements

Everything you need to know about noise power measurements.

More information

Curious to learn more about test fundamentals?

Sign up for our newsletter

Need more information about spectrum analysis?

Just fill out this form and our experts will get back to you shortly.

推广许可

你的申请已提交,我们稍后会联系您。
An error is occurred, please try it again later.