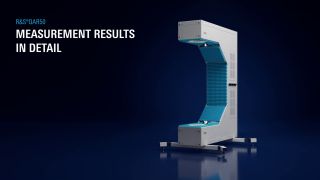
Here we explain the measurement curves and images for different bands and clusters created by the QAR50 and how to interpret them.

R&S®QAR50 高质量汽车电子天线罩测试仪
产品信息


